See What CapturesHuman Attention
Predict where viewers look, measure emotional impact, and optimize visual performance with scientifically-proven AI analysis.
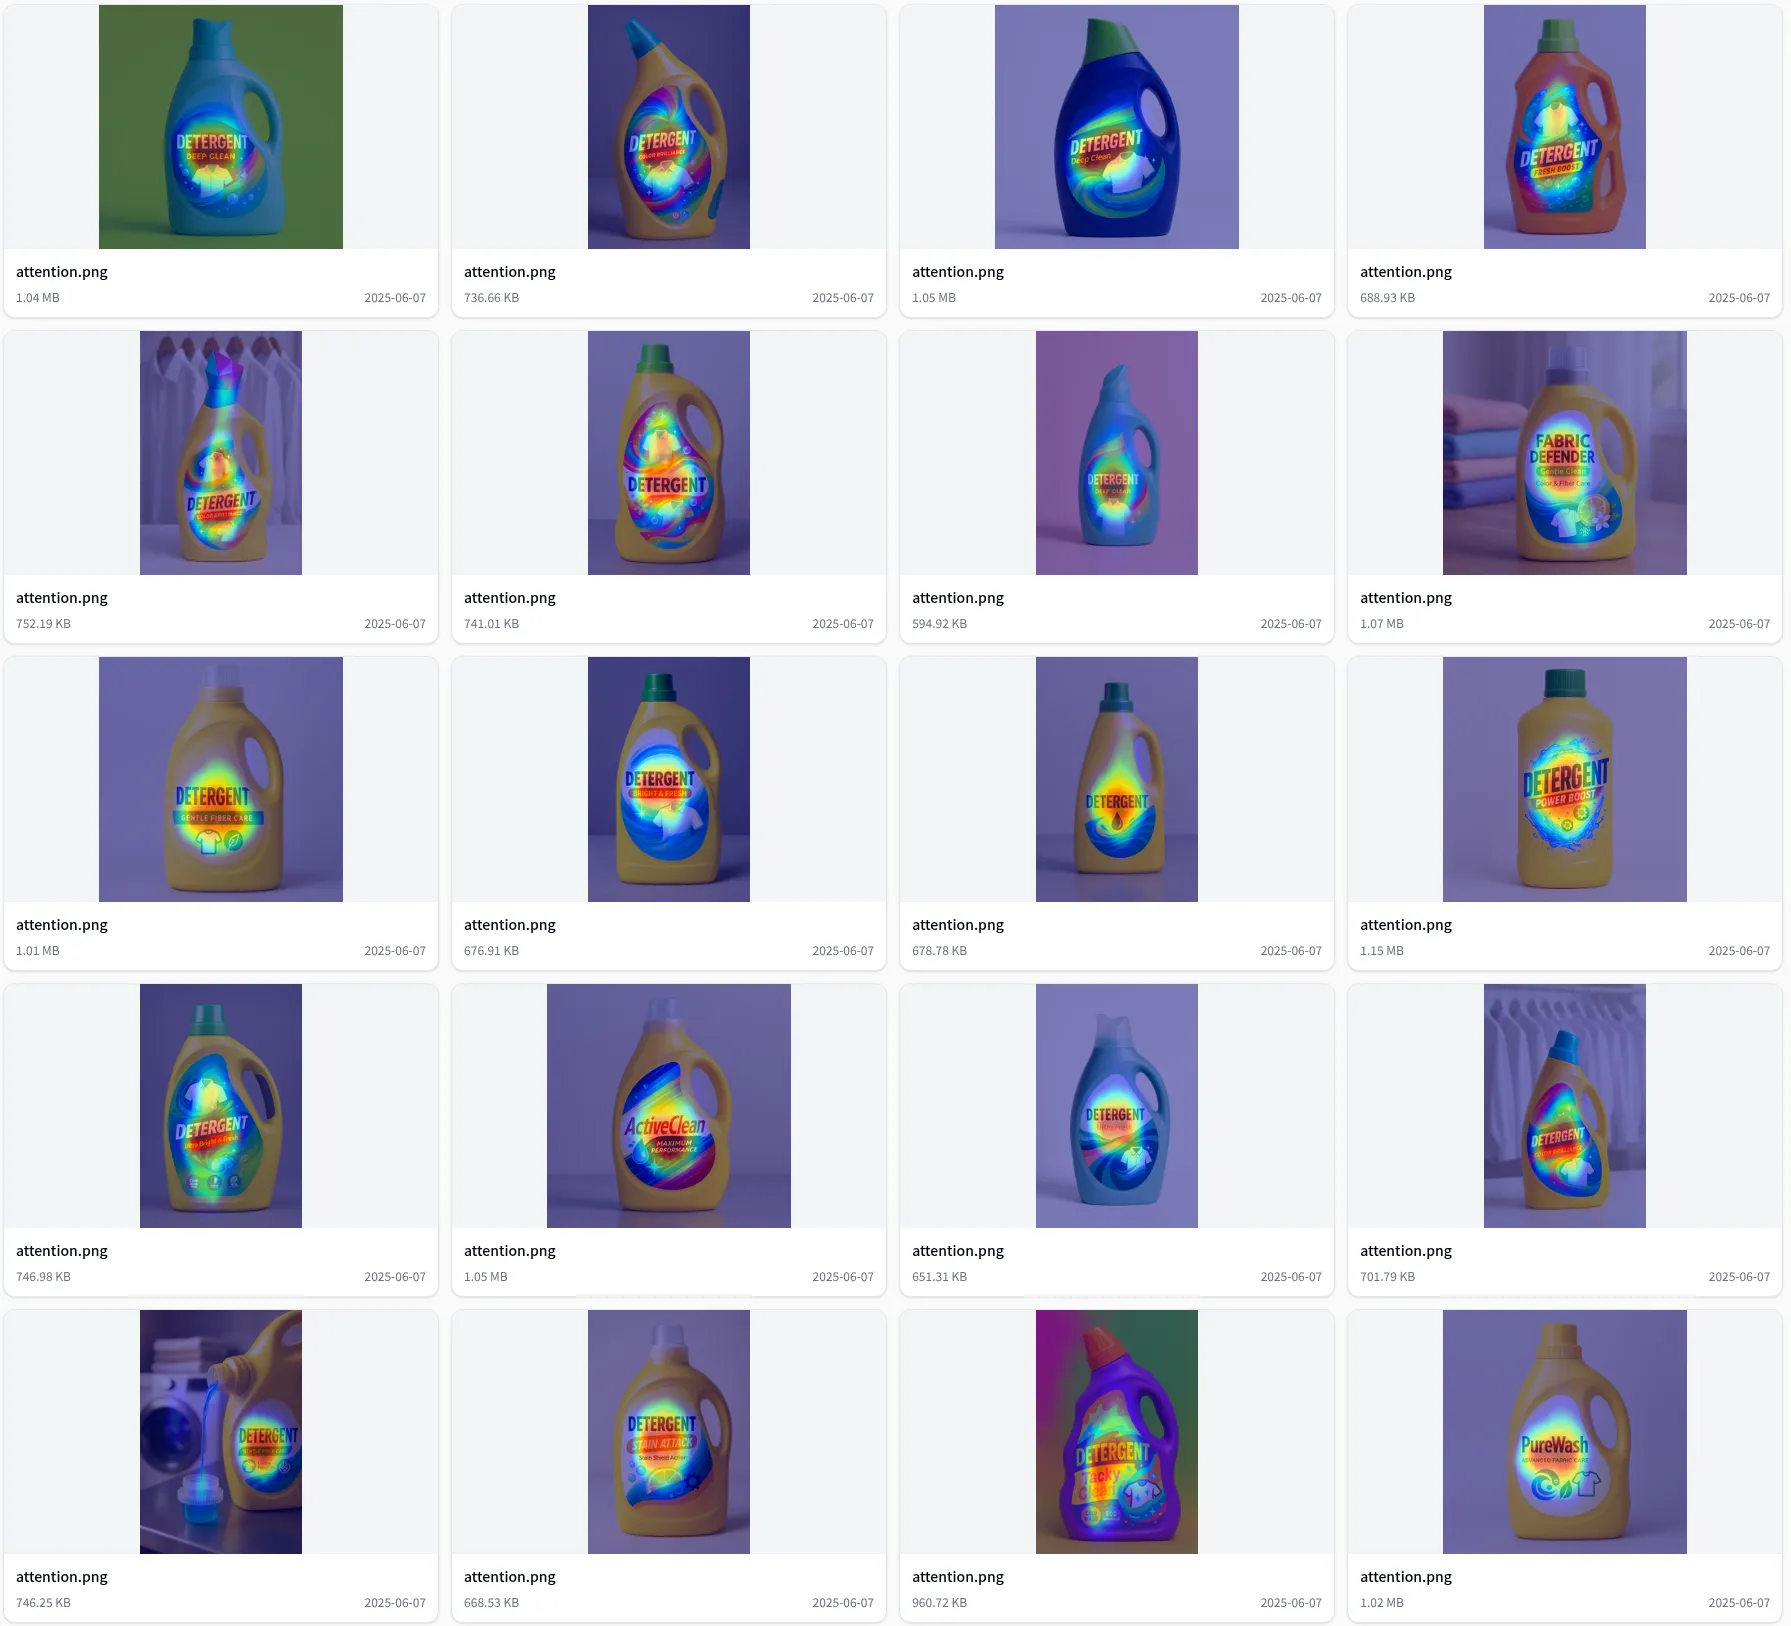
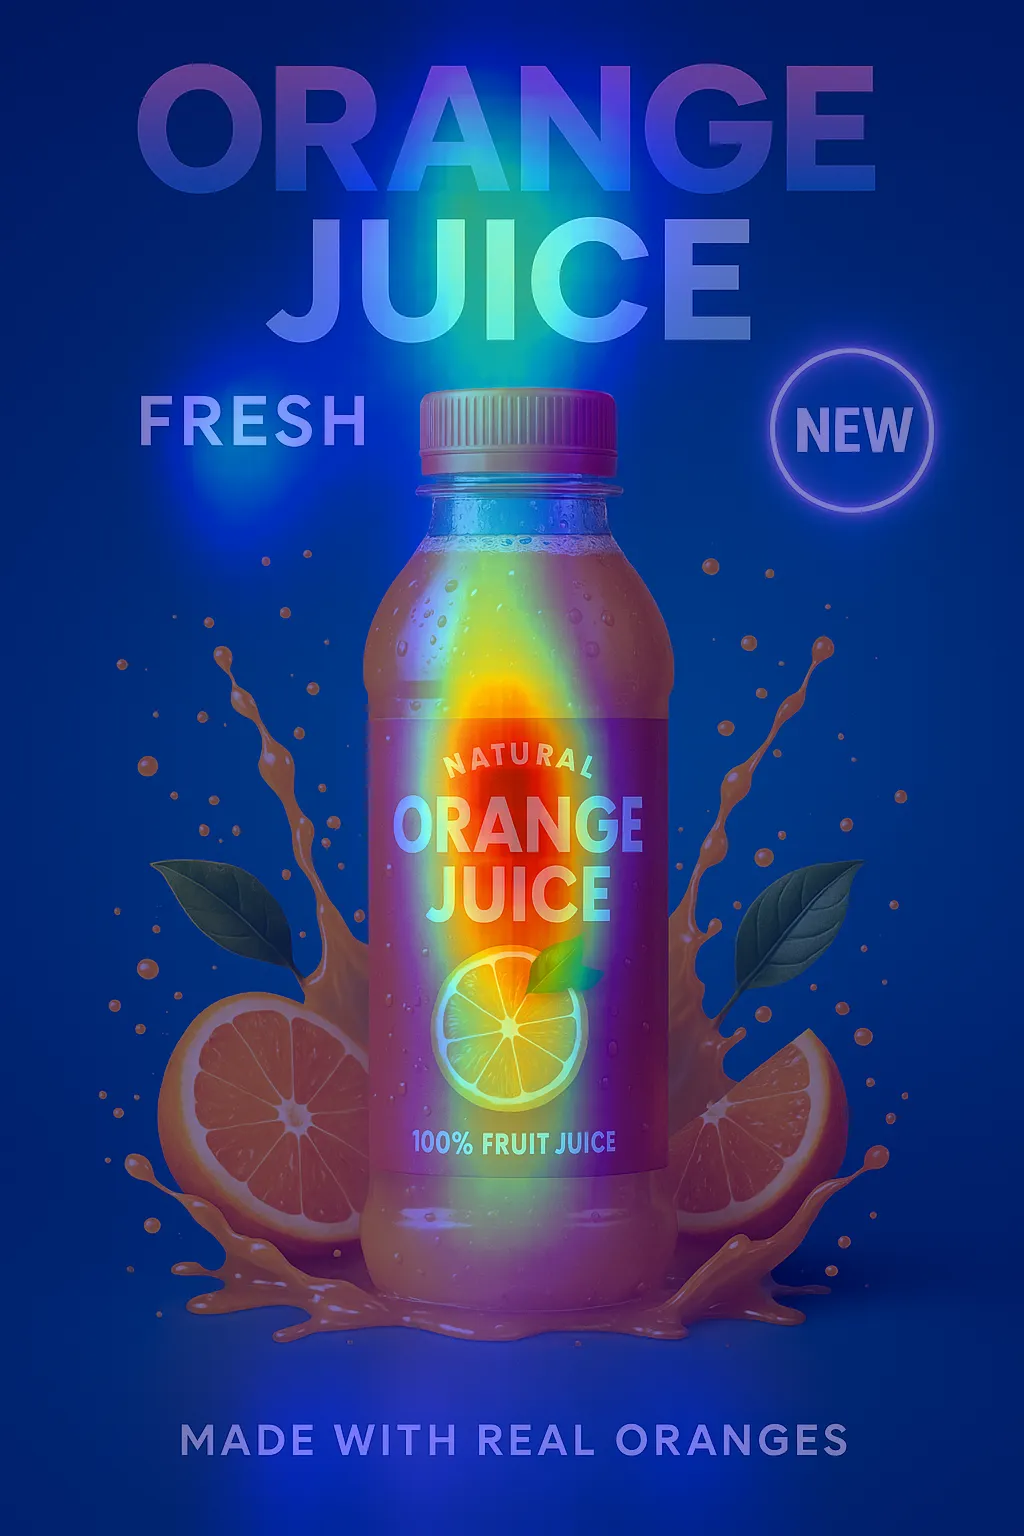
See What Your Audience Sees
Scientifically-proven attention mapping reveals exactly where viewers look first, how long they focus, and what captures their interest most effectively.
Perfect for optimizing product placement, ad layouts, and key messaging positioning.
Data-Driven Decisions
Transform visual analytics into concrete business improvements with comprehensive quality scoring, cognitive impact analysis, and performance benchmarking.
Essential for marketing teams, designers, and brand managers seeking measurable visual performance.
Analyze SmarterOptimize Better
Harness cutting-edge AI models and scientific research to unlock deep insights about your visual content. Make data-driven decisions that drive real business results.
-
Attention Analysis
-
Predict where viewers look first with scientifically-proven attention mapping and gaze path modeling for optimal visual hierarchy.
-
Quality Assessment
-
Comprehensive technical and aesthetic scoring using advanced computer vision research to ensure professional standards.
-
Cognitive Intelligence
-
Comprehensive analysis combining attention patterns, memory factors, emotional responses, and perceptual processing to optimize viewer engagement and decision-making.
-
Color Intelligence
-
Professional color analysis with industry-standard matching and brand consistency validation for cohesive visual identity.
-
Performance Benchmarking
-
Compare your visuals against industry standards and competitor analysis to identify optimization opportunities.
-
Automated Reporting
-
Generate comprehensive reports with actionable insights and recommendations for immediate implementation.
Built onCognitive Science
Our platform combines cutting-edge AI research with proven visual science to deliver professional-grade insights that traditional analytics simply cannot match.
-
Advanced Attention Prediction
-
Proprietary algorithms that understand how human visual attention works, predicting where viewers naturally look without requiring eye-tracking equipment.
-
Visual Memory Intelligence
-
Advanced neural networks trained to predict what images people remember most, helping optimize content for long-term brand recall.
-
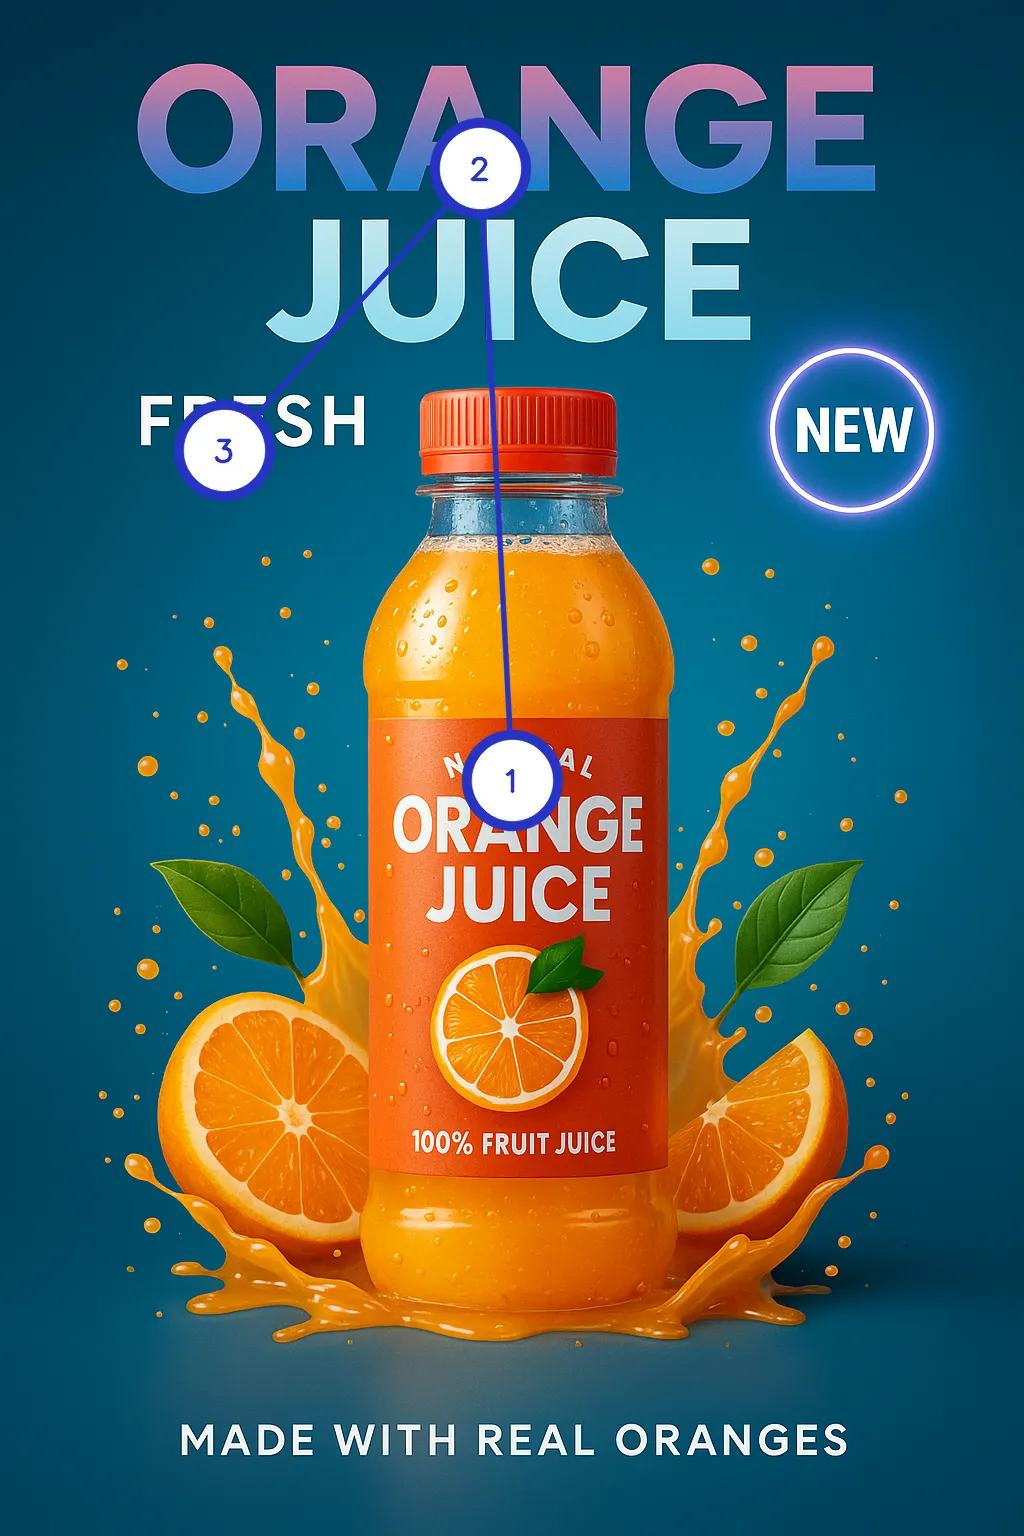
Smart Object Recognition
-
Intelligent systems that understand what's important in your images, from products to faces to text, ensuring attention flows to key elements.
-
Professional Color Science
-
Industry-standard color analysis used by leading brands and design agencies to ensure consistent, impactful visual identity.
-
Gaze Pattern Modeling
-
Combines traditional eye-tracking research with AI to predict viewing sequences and fixation points across different content types.
-
Emotional Impact Analysis
-
Advanced multi-modal AI that analyzes emotional response patterns, measuring how visuals trigger feelings like trust, excitement, or urgency across viewer demographics.
From Upload to InsightsFour steps to better visuals.
Our scientifically-proven analysis pipeline transforms your visual content into actionable business intelligence. Upload, analyze, and optimize with confidence.
Upload & Process
Drag and drop your images for instant AI analysis. Our system automatically processes multiple file formats and resolutions.
Multi-Modal Analysis
Advanced computer vision models work in parallel to analyze attention patterns, quality metrics, and cognitive impact.
Comprehensive Scoring
Receive detailed scores for attention capture, emotional impact, memorability, and technical quality across all dimensions.
Actionable Reports
Get detailed insights with optimization recommendations, benchmark comparisons, and strategic guidance for improved performance.
AI-Generated Insights:
✓ Strong visual hierarchy detected
✓ Optimal color contrast for accessibility
⚠ Consider adjusting focus areas
💡 Boost emotional appeal with warmer tones
Benchmark Comparison:
See How Leading BrandsOptimize Visual Performance
From e-commerce giants to design agencies, businesses across every sector leverage industry-proven visual optimization techniques to achieve measurable performance improvements.
E-commerce Optimization
Optimize product images and layouts to increase conversions and reduce bounce rates.
Key Applications:
Product photo optimization for maximum appeal
Category page layout testing and refinement
Shopping cart abandonment reduction
Mobile vs desktop experience optimization
Industry Benchmarks
Third-party research on visual optimization impact
Source: photoroom.com
Source: numberanalytics.com
Source: Industry avg
📊 Research Note:
Based on industry studies of visual optimization impact on e-commerce conversion rates.
*Actual results may vary based on implementation and market conditions.
Complete Visual IntelligenceSee the Full Picture
Experience comprehensive visual analysis in action. This live demonstration showcases attention mapping, quality assessment, cognitive scoring, and color analysis working together to optimize visual performance.
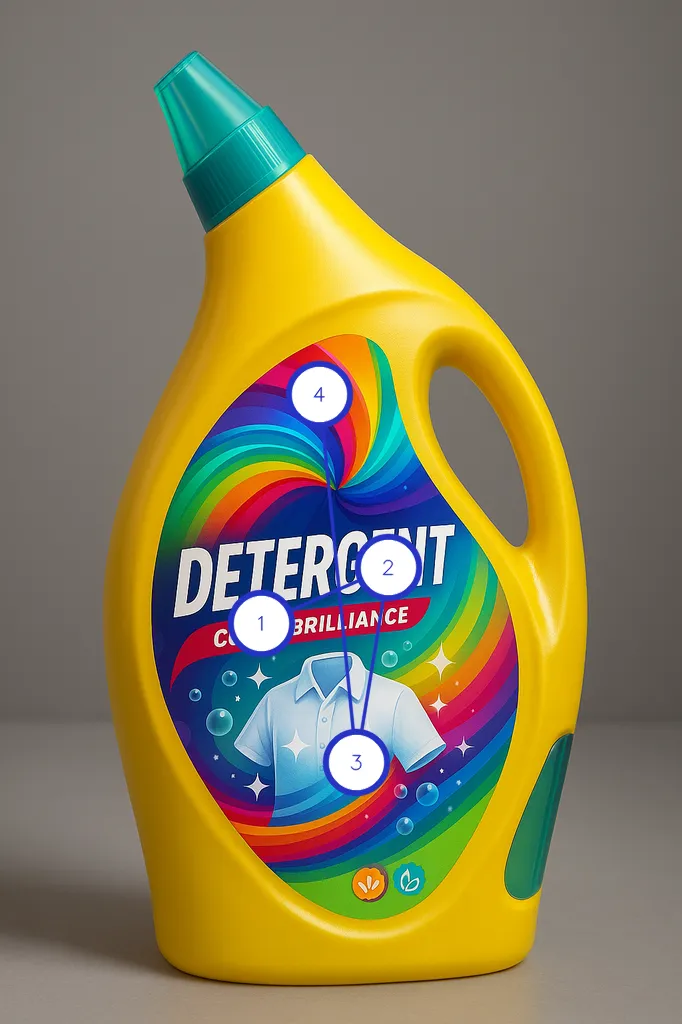
Product Visual Analysis
Complete visual intelligence assessment with cognitive impact analysis
Overall Quality Score
87/100
Cognitive Impact Analysis
Color Analysis
Dominant color distribution
AI-Generated Insights
Strong emotional resonance drives brand recall
High attention capture in key product areas
Optimal color balance for target demographic
Visual hierarchy guides customer focus
Transform Your Visual Strategy Today
Join leading brands using AI-powered visual analytics to optimize marketing performance and drive better results.